Luminescence Kinase Assays Illuminate the Path to Inhibitor Discovery
Background
Protein phosphorylation regulates most aspects of cell biology including cellular division, differentiation, metabolism, and signal transduction, a discovery that earned E. Fisher and E. Krebs the Nobel prize in Physiology in 1992. Kinases catalyze the transfer of a phosphate group from ATP to another molecule, generating ADP in the process. The phosphorylation reaction, therefore, depletes ATP while generating ADP.

Figure 1: Illustration of the phosphorylation reaction catalyzed by kinases.
There are over 500 kinases encoded by the human genome controlling approximately 50% of all cellular functions. Kinases are divided into distinct families based upon their substrates: lipid, nucleotide, carbohydrate, and proteins. Protein Kinases are further classified based on the specific amino acid(s) they phosphorylate, such as tyrosine, serine/threonine, or histidine. Some protein kinases, such as kinases in the MAPK family (mitogen-activated protein kinases) are dual kinases that phosphorylate their substrate on both tyrosine and serine/threonine residues.
Considering the wide-spanning involvement of kinases, it is not surprising to find them implicated in various diseases. Kinases control growth factor-activated signaling pathways that regulate cell proliferation or differentiation. Altered activity of these kinases, often due to genomic rearrangements, gene fusion, amplification, or mutation, result in uncontrolled cell proliferation and is a driver of cancer initiation and progression. Therefore, kinase-directed antibodies (such as Herceptin) and small molecule kinase inhibitors (such as Gleevec) were among the first targeted anti-cancer drugs to reach the clinic.
Screening or characterizing kinase inhibitors requires robust, consistent assays that deliver quality data to advance the best candidates. Historically, radioactivity-based assays using inorganic 32P or 33P (for cellular experiments) or 32γ-ATP (for in vitro biochemical assays) were performed to measure the incorporation of the radioactive phosphate group into the substrate. Non-radioactive assays are now most commonly used.
BPS Bioscience kinase assays rely on either luminescent Kinase-Glo® MAX or ADP-Glo™ reagents to measure substrate phosphorylation. The ADP-Glo™ reagent tends to be more sensitive than the Kinase-Glo® reagent.

Figure 2: Illustration of the Kinase-Glo® assay process.
Kinase-Glo® Kinase Assays
In these kinase assays, the Kinase-Glo® MAX reagent is added as a detection reagent that quantitatively measures the remaining, unused ATP. The reagent is linear up to 500 µM ATP.
Since the luminescent signal correlates with the amount of remaining ATP, it is inversely proportional to kinase activity. Thus, a decrease in the luminescent signal corresponds to higher kinase activity, while an increase in the signal corresponds to lower kinase activity, as shown in Figure 3.
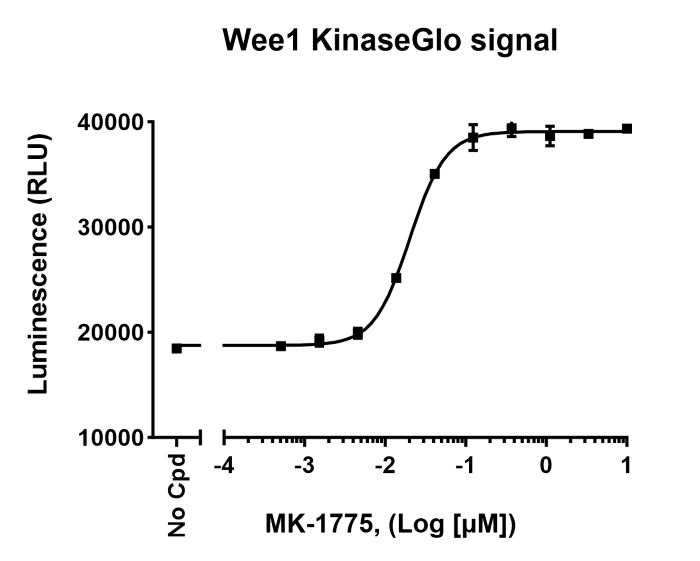
Figure 3: Raw luminescence data obtained by measuring Wee1 kinase activity in the presence of increasing concentrations of inhibitor MK-1775, using Kinase-Glo® MAX reagent (Wee1 Kinase Assay Kit #79909).
Validation graphs shown in the assay kit datasheets typically show results expressed as percent of kinase activity, in which kinase activity in the absence of inhibitor (“positive control”) is set to 100%.
Results are calculated by averaging replicates and subtracting the blank from all experimental values. Thus, for each “test inhibitor” concentration, is calculated as:
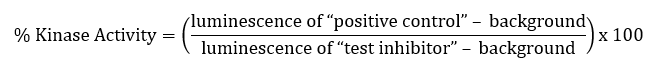

Figure 4: Inhibition of Wee1 kinase activity by MK-1775 measured using Wee1 Kinase Assay Kit (#79909). Results are expressed as percent of activity (positive control without MK-1775 set to 100%).
ADP-Glo™ Kinase assays
The ADP-Glo™ reagent monitors the ADP formed from ATP during the phosphorylation reaction. Therefore, contrary to the Kinase-Glo® MAX reagent, the luminescent signal obtained using ADP-Glo™ correlates directly with kinase activity as shown in Figure 5. Conversely, the effect of an inhibitor will be to decrease the signal proportionally to the inhibition.

Figure 5: Raw luminescence signal obtained by measuring the kinase activity of complex CDK2/CyclinE1 with increasing amounts of the complex using the ADP-Glo™ Kinase Assay reagent.
Validation graphs shown in the assay kit datasheets show results expressed as percent of kinase activity, in which kinase activity in the absence of inhibitor (“positive control”) is set to 100%.
Results are calculated by averaging replicates and subtracting the blank from all experimental values. Thus, for each “test inhibitor” concentration, calculate:


Figure 6: Inhibition of CDK2/CyclinE1 kinase activity by Olomoucine measured using Chemi-Verse™ CDK2/CyclinE1 Kinase Assay Kit (#82228). Results are expressed as percent of activity (positive control without Olomoucine set to 100%).
Conclusion
Our in-house developed assay kits provide optimal accuracy in determining inhibitory concentrations. The assay formats are also optimized for high-throughput screening using homogeneous no-wash assays. Discover our vast selection of over 160 assay kits, including kinase family panels for selectivity assessment.