Fluorescence Polarization Assays: Principles & Applications
Fluorescence Polarization (FP) technology measures changes in light polarization emitted by a fluorescent tracer in a sample and is quite different from fluorescence intensity, which measures the intensity of emitted light at a specific wavelength. FP is widely used to monitor molecular interactions in solution as it is easily amenable to high-throughput formats and screening applications. FP is a complex technique that requires careful design and uses a specific instrument (a plate reader with fluorescence filters capable of polarized light excitation and capture of emitted light on two planes). This note explores the principles underlying the technology and FP-based experiments.
Principles of FP
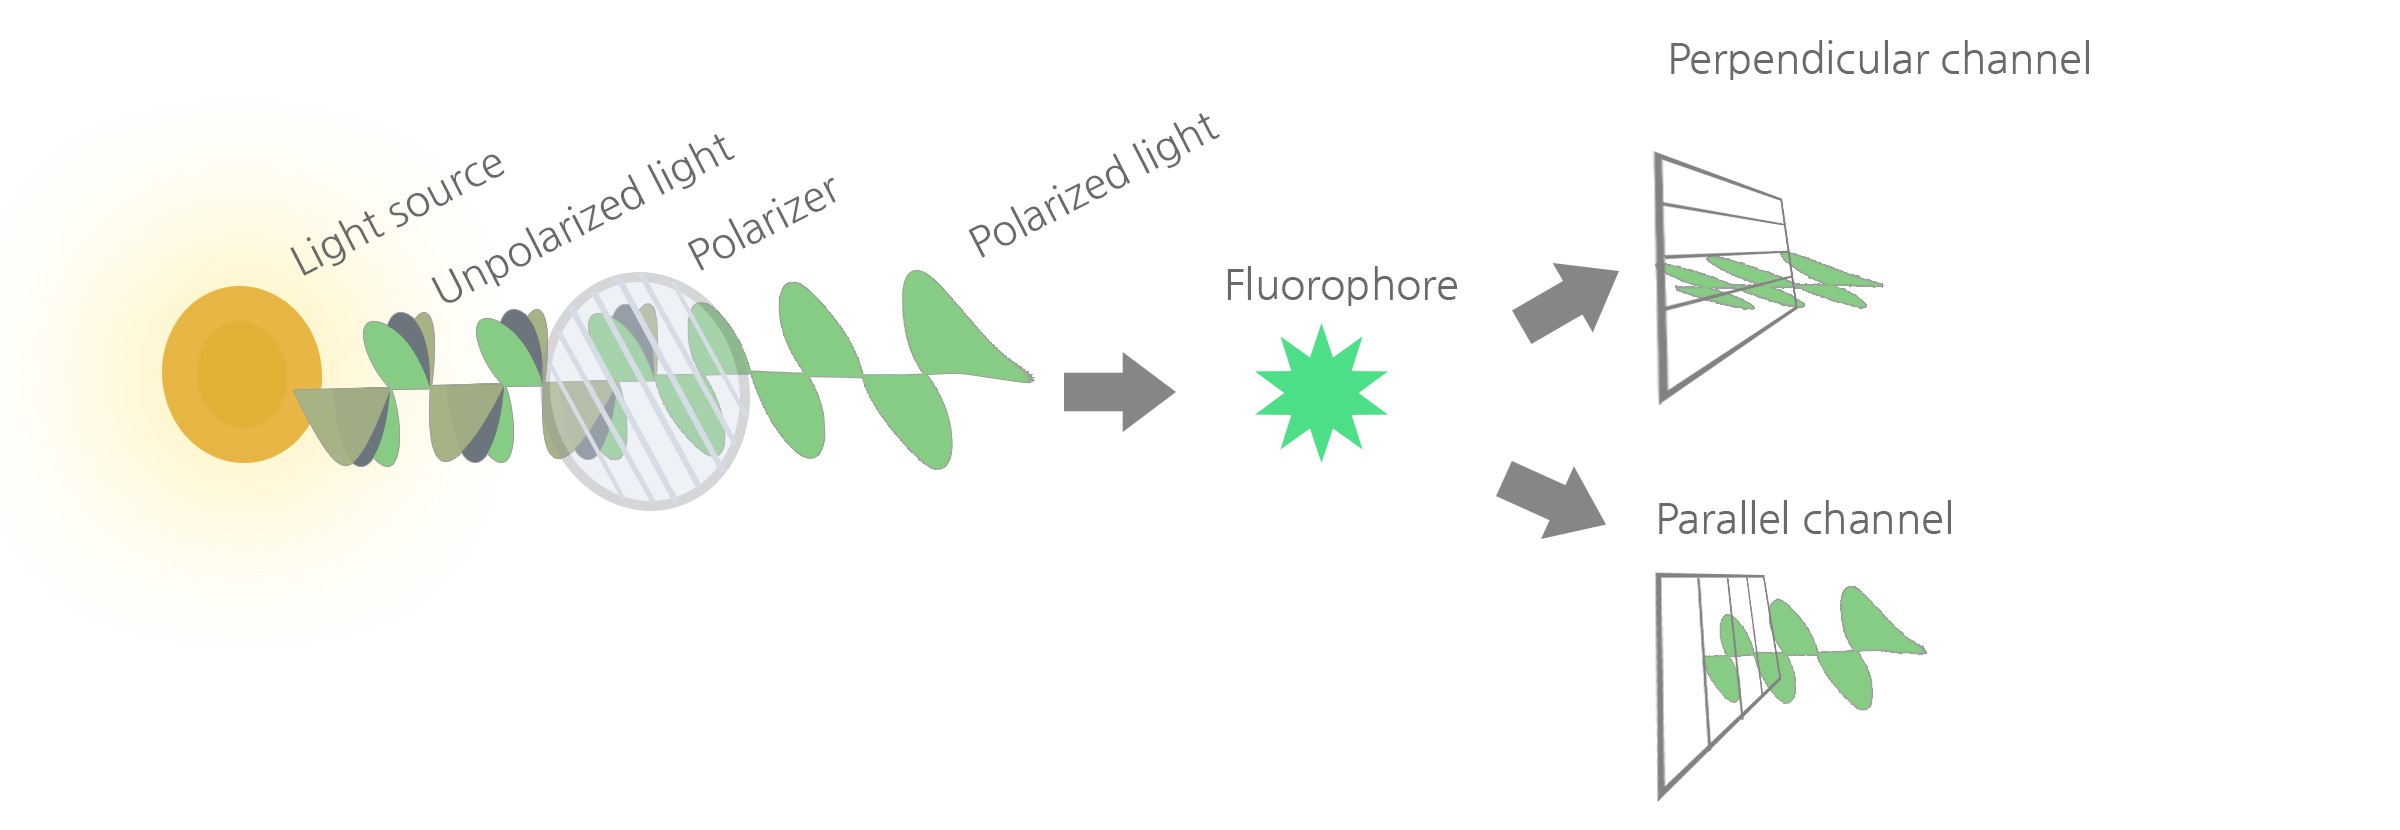
In FP technology, the fluorescent dye is excited by polarized light. Although the initial light source emits light in all directions, a polarizer filters the light and limits it to a single plane along the direction of propagation. When a fluorescent dye is excited by the polarized single plane light, it re-emits light in all directions (i.e., it depolarizes the excitation light), because it moves around and rotates between the time of excitation and the time of emission. The molecular rotation is due to Brownian movement, which happens within nanoseconds, and the extent of light depolarization is proportional to this movement. Indeed, the polarization of the light re-emitted by a fluorophore decreases as increasing temperature accelerates Brownian movement, whereas it increases as high solvent viscosity slows the movement of the fluorophore. Similarly, Brownian movement decreases as the size of the fluorophore increases, and this increases the retention of polarization (history of FP and theoretical foundations are reviewed in [1]).
The degree of light polarization of a fluorescent probe is therefore inversely proportional to Brownian movements. Consequently, FP is affected by all parameters that alter the rotation and random movement of a molecule such as size, shape (a sphere rotates faster), solvent viscosity and temperature. When temperature and viscosity are kept constant, size becomes the main factor driving FP, which is then directly proportional to the size of the fluorescent probe.
To summarize, the degree of polarization of a fluorescent probe is a term that indicates to what extent the light of excitation remains polarized. When a small fluorophore is excited by polarized light, its movement is fast, and it re-emits light in all directions: it depolarizes the light of excitation and the degree of polarization is low. On the contrary, reorientation of a large fluorophore excited by polarized light is limited: the light remains mostly polarized at re-emission and the degree of polarization is high.
Experimentally, FP technology measures fluorescence intensity emitted by the fluorophore in the two planes of light that are parallel and perpendicular relative to the plane of excitation. The degree of fluorescence polarization (P) is defined as the difference between the fluorescence intensity parallel and perpendicular relative to the plane of excitation, divided by the total fluorescence intensity:

I‖ = Fluorescence Intensity parallel to plane of excitation
I┴ = Fluorescence Intensity perpendicular to plane of excitation
Most instruments display fluorescence polarization in units of mP in which 1 mP = 1000 P

Since (P) is a ratio of light intensities, it is a number without dimension. Theoretical (P) values range from –0.33 to 0.5 (–330 to 500 mP). Experimental data typically range from 10 mP to around 300 mP. Instruments achieve very precise measurements (P ± 0.002 or ± 2 mP).
The equation above assumes that light is transmitted equally well through both parallel and perpendicular channels. In practice, this is not true and a correction must be made. The correction factor is called the "G Factor".

The G-factor is instrument-dependent and needs to be determined by the investigator. The instrument manual will contain information about how to establish the G-factor.
FP Assays
FP assays measure changes in light polarization that occur when a small fluorophore interacts with, or dissociates from, a much larger partner. Any small molecule which can be covalently labeled with a fluorophore and can form a complex with a larger partner is amenable to FP.
Several controls are necessary to conduct a successful experiment:
- “Blank” contains buffers and solvent but does not contain the tracer or the binding partner. It measures the small auto-fluorescence generated by the reagents and should be lower than the “Reference”. It is subtracted from all measurements.
- “Reference” is an internal control that contains the tracer but does not contain the binding partner. It is the lowest FP allowed by the experimental conditions since all of the fluorescent tracer is present in free form.
- “High FP” is an internal control corresponding to the highest FP allowed by the experimental conditions, in which most or all available tracer is present in its bound state. In many (but not all) types of assays, this is the same as the “Positive Control”.
- “Positive Control” is the experimental control. For example, if an inhibitor is being tested, the positive control is the condition without the inhibitor.
Depending on the experimental setting and type of assay, the “high FP” control can be omitted if it is the same as the positive control.
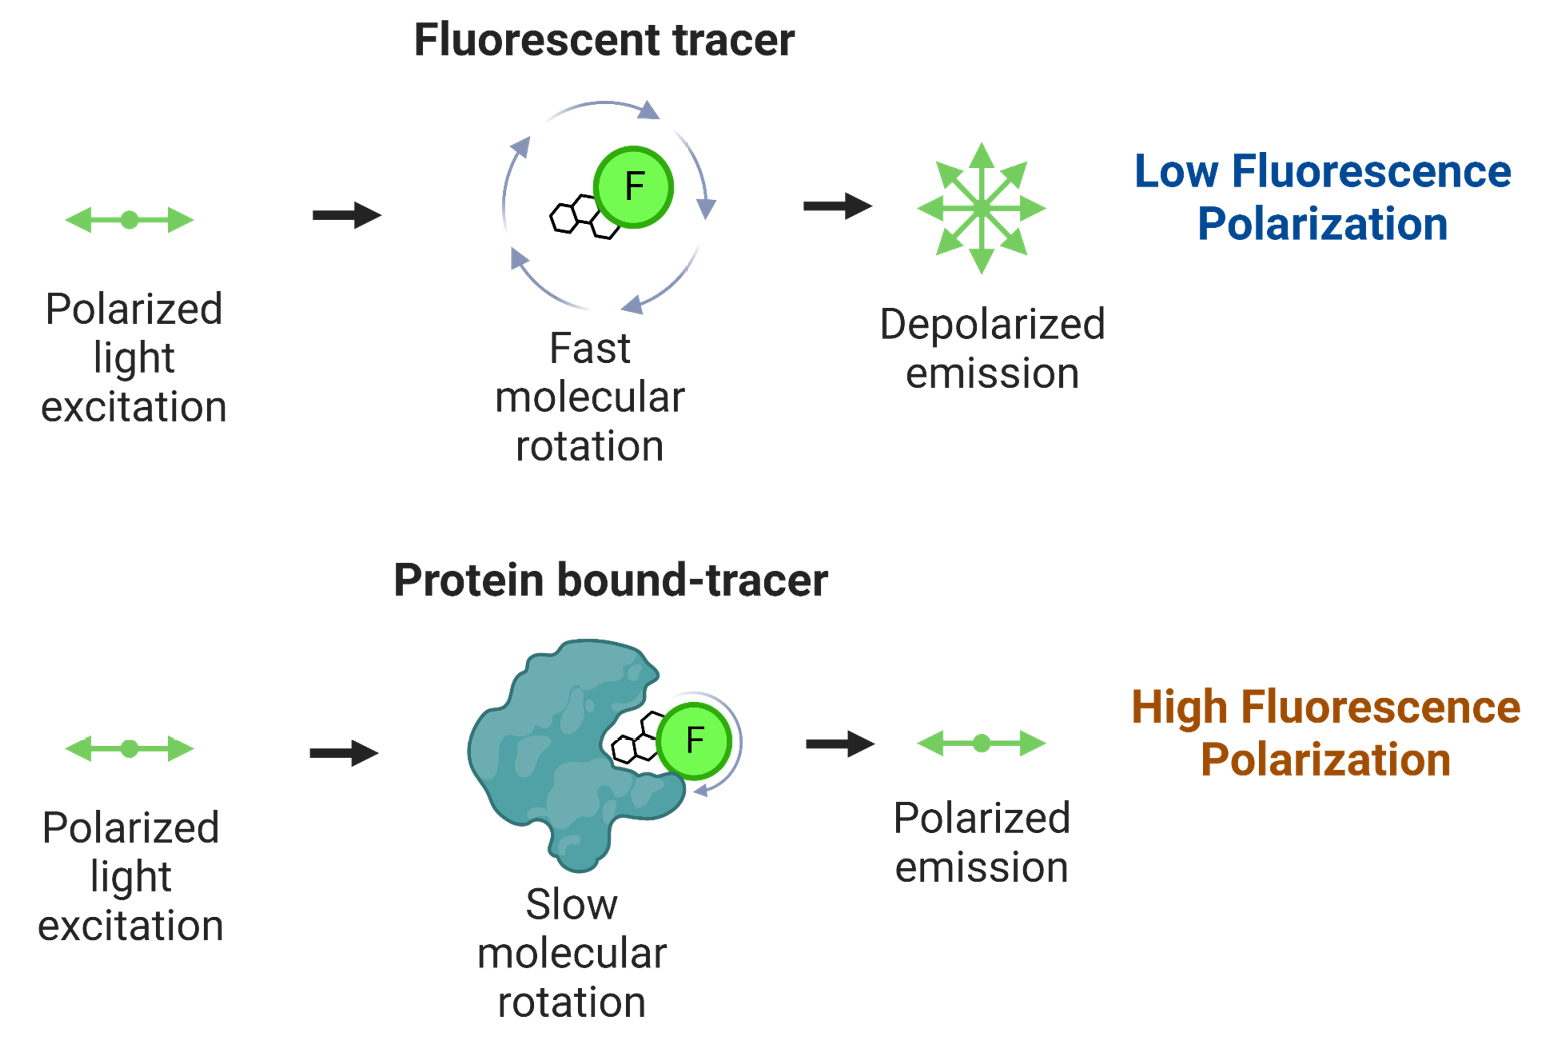
Illustration. Upon binding to a much larger partner, the rotation of a small fluorophore becomes limited. When excited with polarized light it now emits mostly polarized light.
Measurements and calculations in practice
The user may ignore the G-factor when all experiments are performed using the same instrument since it is instrument-dependent.
If desired the G-factor is set before measurements are performed. It needs to be determined by the investigator when not clearly indicated by the manufacturer. The instrument manual will contain information about how to establish the G-factor. For example, BPS Bioscience’s scientists use a Tecan fluorescent plate reader which has a G value set to 22 mP.
Instruments provide measurement in milli-Polarization = mP (as explained above, this is a measure of ratio of two measurements in two light polarization planes and is calculated directly by the instrument).
Results are calculated as follows.
- Subtract the Blank value from all other values
- Calculate ΔmP for all sample:
ΔmP = (mP value of the sample) – (mP of the Reference control)
Where mP refers to milli-Polarization values provided by the instrument and Reference control is the mP value obtained in the condition containing only the fluorescent probe (a condition in which the probe is in free state).
Applications
FP is applicable to any experiment that involves the molecular binding of two entities where one is much smaller than the other, as long as the smaller entity can be fluorescently labeled [2]. It is rather straightforward to establish a competition or an inhibition assay; proteolysis and other enzymatic assays have been developed as well. A general procedure for the development of FP assays can be found in [3].
- Binding of an antibody to a small antigen or an epitope
- Receptor–ligand and protein-protein interaction
- Protein–DNA and protein-RNA interaction
- Enzymatic reaction: substrate binding to the enzyme or formation of a new product
- Proteolysis
- Formation of a new product that is distinguished using specific fluorescent-beads. For example, measure of phosphorylation using a fluorescent antibody specific for the phosphorylated product
- Detection of specific PCR products [4]
- Competition studies in which the tracer is displaced, determination of EC50
- High-throughput screening of small molecule inhibitors
- Screening for inhibitors of alpha-synuclein oligomerization [5]
- Study of muscle function [6]
Advantages and limitations
Although FP assays are complex to develop, a well-designed assay is simple to use and highly amenable to high-throughput formats. Here are a few characteristics that make FP assays particularly attractive.
Advantages
- In-solution
- Tolerates very small volumes
- Homogenous, no wash steps
- Non-radioactive
- Real-time
- Less dye dependent and less susceptible to pH interference than fluorescence intensity assays
Limitations
- No kinetic constants
- The fluorescent tag, if not properly designed, may alter the binding properties of the tracer
- Sensitivity to changes in temperature
Considerations
Factors that do not interfere significantly:
- Buffer pH
- Dye concentration
- Color additives
Critical factors:
- A change in size, ideally by a factor ≥5 times, is the most critical factor. The higher the difference, the more robust the measurements will be.
- Fluorescent molecules have an excited state, and the longer the molecule remains excited the more it rotates. This does not affect measurements as it is an intrinsic property of the fluorophore that remains constant throughout the experiment. However, it influences the choice of fluorophore since stable fluorophores allow for more robust measurements.
- The performance of an assay depends on the extent to which the biological activity of the small tracer is disrupted by the labeling. The choice of fluorophore is a critical factor. Validation is critical to ensure that labeling does not alter the tracer’s interaction with the molecule of interest or does not affect the enzymatic reaction under study.
- The tracer should be >90 % labeled and the free dye should be eliminated. If a high percentage of tracer remains unlabeled, it will compete with the labeled tracer for binding to the partner, which will alter the apparent IC50. Failure to eliminate the free dye results in a high background signal that decreases the sensitivity of the assay.
- The purity of the components influences assay quality. Potential interference in light scattering can be caused by large molecules, such as cell or membrane debris, therefore the partner protein must be pure. For this reason, crude cell lysates or cell culture supernatants should be avoided. The presence of contaminants with high background fluorescence, or large molecules with non-specific trapping ability such as albumin is likely to interfere with the signal. Cleanliness of glass vessels and uncontaminated buffers are all important factors when performing FP assays.
Conclusion
BPS Bioscience offers validated FP-based assay kits, saving scientists time and money by eliminating the need for many steps of optimization such as experimental design, labeling and validation of the fluorescent tracer, or buffer composition. Our kits contain high-quality purified proteins and are provided with a validated protocol.
References
(1) Jameson DM, Croney JC. 2003 Comb Chem High Throughput Screen. 6(3): 167-173. PMID: 12678695.
(2) Hendrickson OD, et al. 2020 Sensors 20(24): 7132. PMID: 33322750.
(3) Moerke NJ. 2009 Curr Protoc Chem Biol. 1(1): 1-15. PMID: 23839960.
(4) Kido C, et al. 2000 Gene 259(1-2): 123-127. PMID: 11163969.
(5) Luk KC, et al. 2007 Biochemistry 46(44): 12522-12529. PMID: 17927212.
(6) Nihel T, et al. 1974 Proc Natl Acad Sci U S A. 71(2): 274-277. PMID: 4521799.